Kotlin Notebook 支持的输出格式
Kotlin Notebook supports a variety of output types, including text, HTML, and images. With the help of external libraries, you can expand your output options and visualize your data with charts, spreadsheets, and more.
Each output is a JSON object that maps the Jupiter MIME type to some data. From this map, Kotlin Notebook selects the supported MIME type with the highest priority among other types and renders it like this:
- Text uses the
text/plainMIME type. - The BufferedImage class uses the
image/pngMIME type that is mapped to a Base64 string. - The Image class, as well as the LaTeX format, use the
text/htmlMIME type with theimgtag inside. - Kotlin DataFrame tables and Kandy plots use their own internal MIME types, which are backed by static HTML or images. This way, you can display them on GitHub.
You can set up the mapping manually, for example, to use Markdown as a cell output:
MimeTypedResult(
    mapOf(
        "text/plain" to "123",
        "text/markdown" to "# HEADER",
        //other mime:value pairs
    )
)
To display any kind of output, use the DISPLAY() function. It also enables the combination of several outputs:
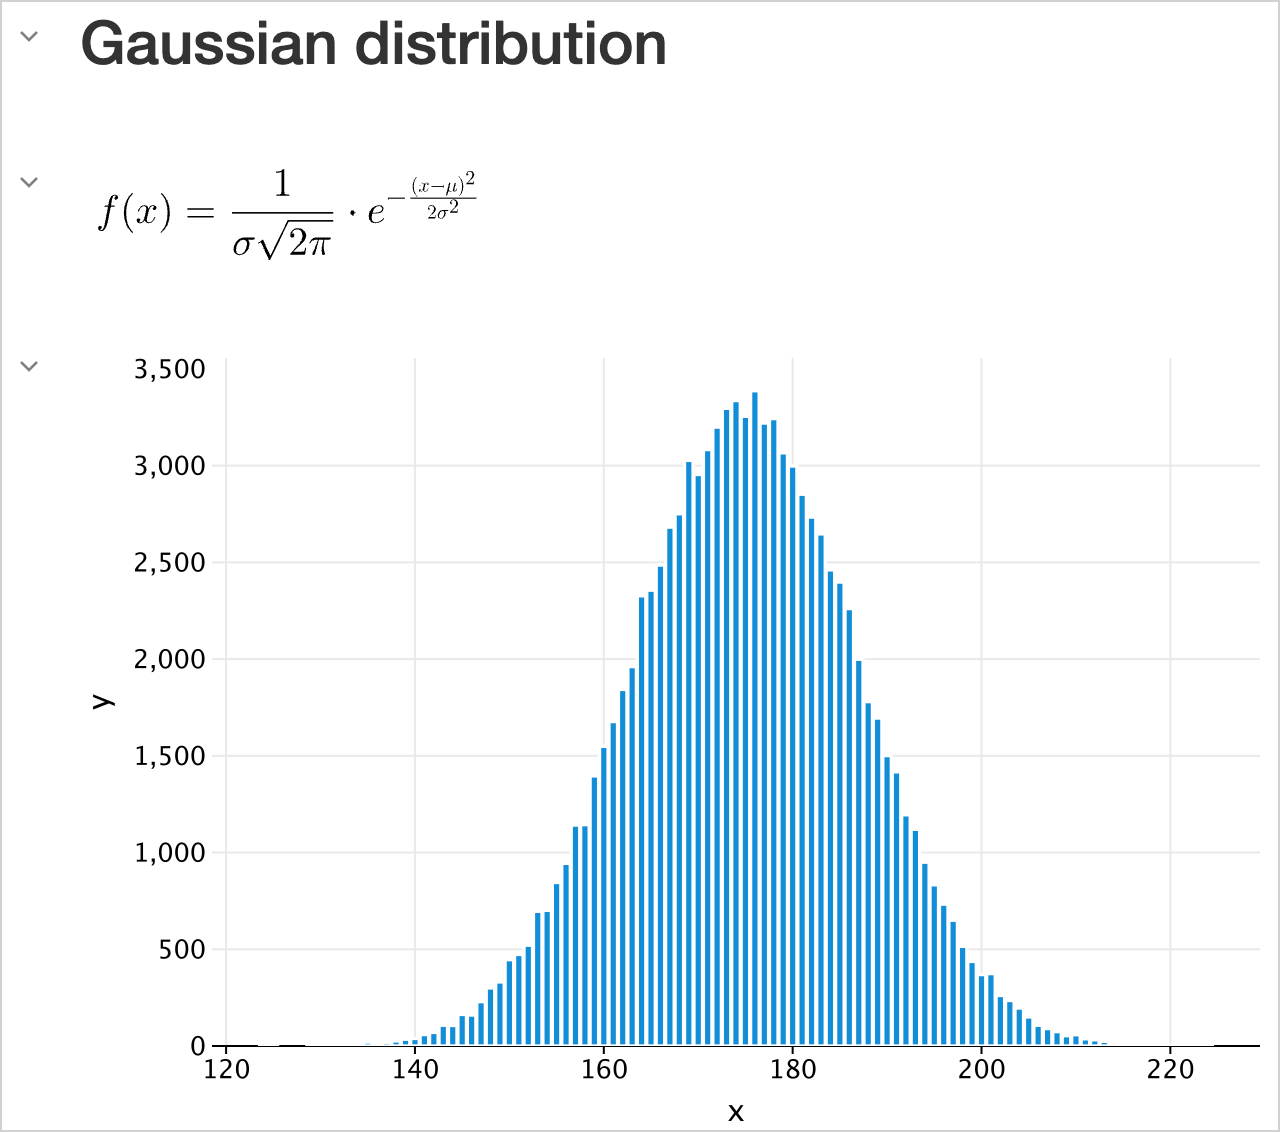
DISPLAY(HTML("<h2>Gaussian distribution</h2>"))
DISPLAY(LATEX("f(x) = \\frac{1}{\\sigma \\sqrt{2\\pi}} \\cdot e^{-\\frac{(x - \\mu)^2}{2\\sigma^2}}"))

val experimentX = experimentData.map { it.key }
val experimentY = experimentData.map { it.value }

DISPLAY(plot {
    bars {
        x(experimentX)
        y(experimentY)
    }
})
Texts
Plain text
The simplest output type is plain text. It's used in printed statements, variable values, or any text-based output from your code:
val a1: Int = 1
val a2: Int = 2
var a3: Int? = a1 + a2

"My answer is $a3"
- If a cell's result cannot be rendered
and displayed as any of the output types, it will be printed as plain text using the
toString()function. - If your code contains errors, Kotlin Notebook displays an error message and a traceback, providing insights for debugging.
Rich text
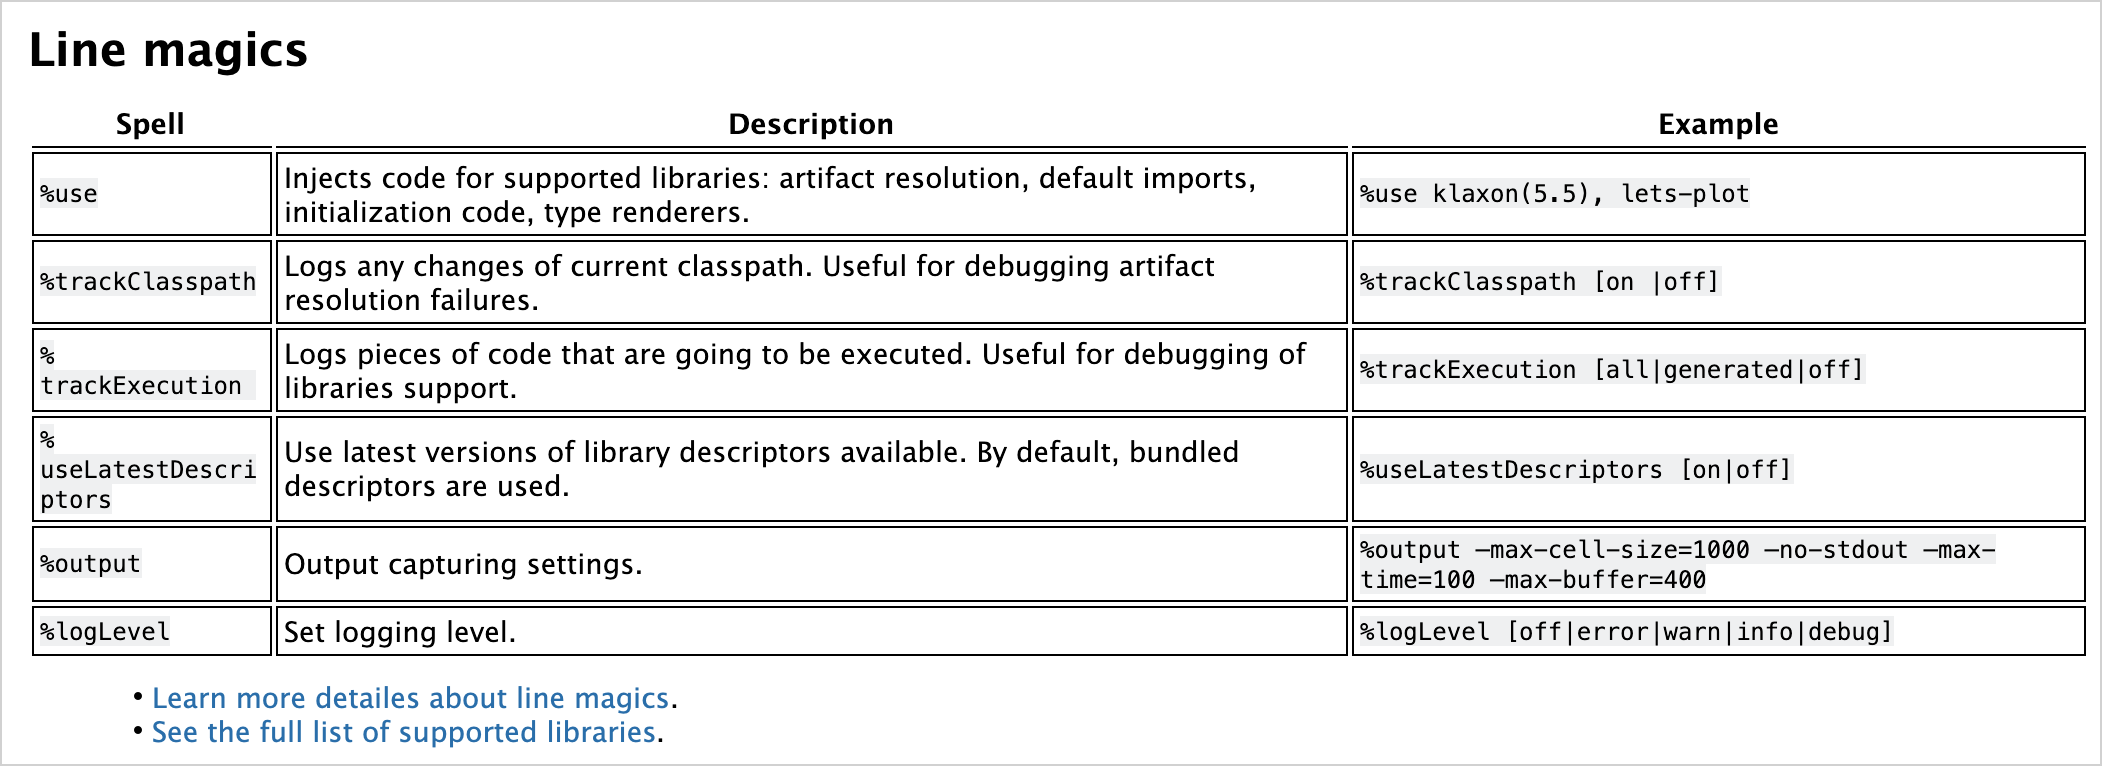
Choose cells of the Markdown type to use rich text. This way, you can format the content with Markdown and HTML markup, using lists, tables, font styles, code blocks, and more. HTML can contain CSS styles and JavaScript.
## Line magics

| Spell                              | Description                                                                                                      | Example                                                                               |
|------------------------------------|------------------------------------------------------------------------------------------------------------------|---------------------------------------------------------------------------------------|
| <code>%use</code>                  | Injects code for supported libraries: artifact resolution, default imports, initialization code, type renderers. | <code>%use klaxon(5.5), lets-plot</code>                                              |
| <code>%trackClasspath</code>       | Logs any changes of current classpath. Useful for debugging artifact resolution failures.                        | <code>%trackClasspath [on |off]</code>                                                |
| <code>%trackExecution</code>       | Logs pieces of code that are going to be executed. Useful for debugging of libraries support.                    | <code>%trackExecution [all|generated|off]</code>                                      |
| <code>%useLatestDescriptors</code> | Use latest versions of library descriptors available. By default, bundled descriptors are used.                  | <code>%useLatestDescriptors [on|off]</code>                                           |
| <code>%output</code>               | Output capturing settings.                                                                                       | <code>%output --max-cell-size=1000 --no-stdout --max-time=100 --max-buffer=400</code> |
| <code>%logLevel</code>             | Set logging level.                                                                                               | <code>%logLevel [off|error|warn|info|debug]</code>                                    |

<ul><li><a href="https://github.com/Kotlin/kotlin-jupyter/blob/master/docs/magics.md">Learn more detailes about line magics</a>.</li>
<li><a href="https://github.com/Kotlin/kotlin-jupyter/blob/master/docs/magics.md">See the full list of supported libraries</a>.</li></ul>
HTML
Kotlin Notebook can render HTML directly, executing scripts or even embedding websites:
HTML("""
<p>Counter: <span id="ctr">0</span> <button onclick="inc()">Increment</button></p>
<script>
    function inc() {
        let counter = document.getElementById("ctr")
        counter.innerHTML = parseInt(counter.innerHTML) + 1;
}
</script>
""")

Mark your notebook as Trusted at the top of the file to be able to execute scripts.
Images
With Kotlin Notebook, you can display images from files, generated graphs, or any other visual media.
Static images can be displayed in formats such as .png, jpeg, and .svg.
Buffered images
By default, you can use BufferedImage class to display images:
import java.awt.Color
import java.awt.image.BufferedImage

val width = 300
val height = width

val image = BufferedImage(width, height, BufferedImage.TYPE_INT_ARGB)

val graphics = image.createGraphics()
graphics.background = Color.BLACK
graphics.clearRect(0, 0, width, height)
graphics.setRenderingHint(
    java.awt.RenderingHints.KEY_ANTIALIASING,
    java.awt.RenderingHints.VALUE_ANTIALIAS_ON
)
graphics.color = Color.WHITE
graphics.fillRect(width / 10, height * 8 / 10, width * 10 / 20, height / 10)
graphics.dispose()

Loaded images
With the help of the lib-ext library, you can extend the standard Jupyter functionality and display images loaded
from the network:
%use lib-ext(0.11.0-398)
Image("https://kotlinlang.org/docs/images/kotlin-logo.png", embed = false).withWidth(300)

Embedded images
A disadvantage of images loaded from the network is that the image disappears if the link breaks or if you lose the network connection. To work around that, use embedded images, for example:
val kotlinMascot = Image("https://blog.jetbrains.com/wp-content/uploads/2023/04/DSGN-16174-Blog-post-banner-and-promo-materials-for-post-about-Kotlin-mascot_3.png", embed = true).withWidth(400)
kotlinMascot

Math formulas and equations
You can render mathematical formulas and equations using the LaTeX format, a typesetting system widely used in academia:
Add the
lib-extlibrary that extends the functionality of the Jupyter kernel to your notebook:%use lib-ext(0.11.0-398)In the new cell, run your formula:
LATEX("c^2 = a^2 + b^2 - 2 a b \\cos\\alpha")
Data frames
With Kotlin Notebook, you can visualize structured data with data frames:
Add the Kotlin DataFrame library to your notebook:
%use dataframeCreate the data frame and run it in the new cell:
val months = listOf(
    "January", "February",
    "March", "April", "May",
    "June", "July", "August",
    "September", "October", "November",
    "December"
)

// Sales data for different products and months:
val salesLaptop = listOf(120, 130, 150, 180, 200, 220, 240, 230, 210, 190, 160, 140)
val salesSmartphone = listOf(90, 100, 110, 130, 150, 170, 190, 180, 160, 140, 120, 100)
val salesTablet = listOf(60, 70, 80, 90, 100, 110, 120, 110, 100, 90, 80, 70)

// A data frame with columns for Month, Sales, and Product
val dfSales = dataFrameOf(
    "Month" to months + months + months,
    "Sales" to salesLaptop + salesSmartphone + salesTablet,
    "Product" to List(12) { "Laptop" } + List(12) { "Smartphone" } + List(12) { "Tablet" },
)
The data frame uses the
dataFrameOf()function and includes the number of products (laptops, smartphones, and tablets) sold in a 12-month period.Explore the data in your frame, for example, by finding the product and month with the highest sales:
dfSales.maxBy("Sales")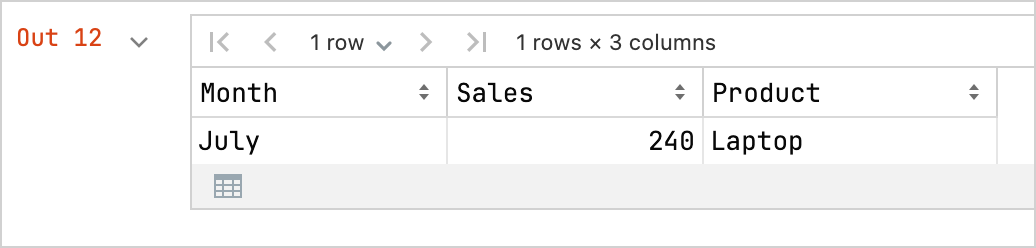
You can also export your data frame as a CSV file:
// Export your data to CSV format
dfSales.writeCSV("sales-stats.csv")
Charts
You can create various charts directly in your Kotlin Notebook to visualize your data:
Add the Kandy plotting library to your notebook:
%use kandyUse the same data frame and run the
plot()function in the new cell:val salesPlot = dfSales.groupBy { Product }.plot { bars { // Access the data frame's columns used for the X and Y axes x(Month) y(Sales) // Access the data frame's column used for categories and sets colors for these categories fillColor(Product) { scale = categorical( "Laptop" to Color.PURPLE, "Smartphone" to Color.ORANGE, "Tablet" to Color.GREEN ) legend.name = "Product types" } } // Customize the chart's appearance layout.size = 1000 to 450 layout.title = "Yearly Gadget Sales Results" } salesPlot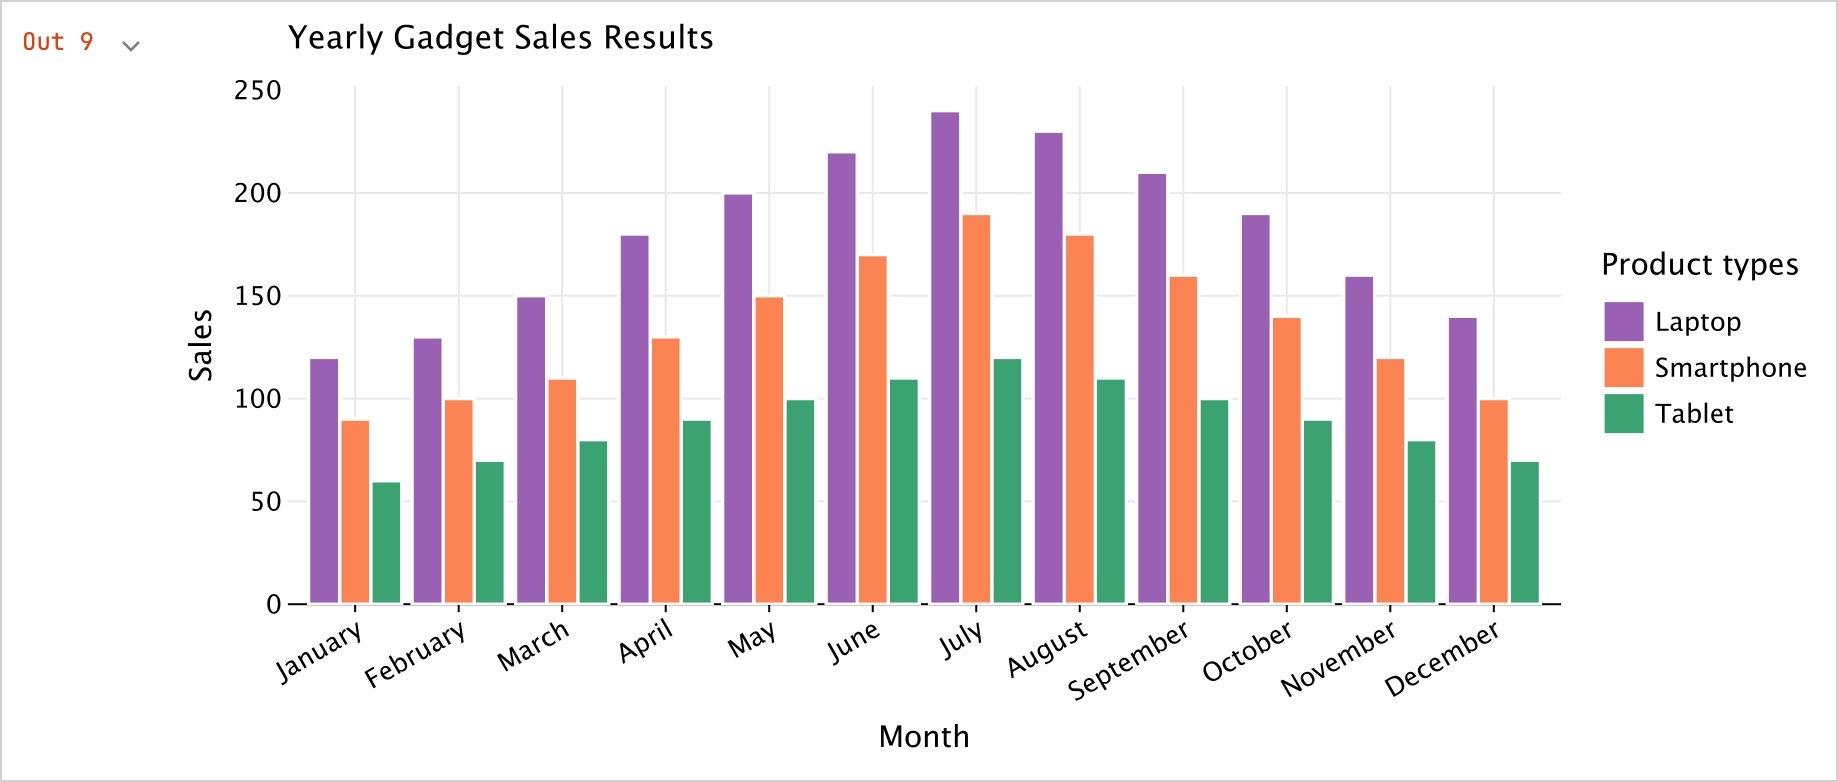
You can also export your plot in the
.png,jpeg,.html, or.svgformat:// Specify the output format for the plot file: salesPlot.save("sales-chart.svg")