调试 Kotlin/Wasm 代码
Kotlin/Wasm is Alpha. It may be changed at any time.
This tutorial demonstrates how to use your browser to debug your Compose Multiplatform application built with Kotlin/Wasm.
Before you start
Create a project using the Kotlin Multiplatform wizard:
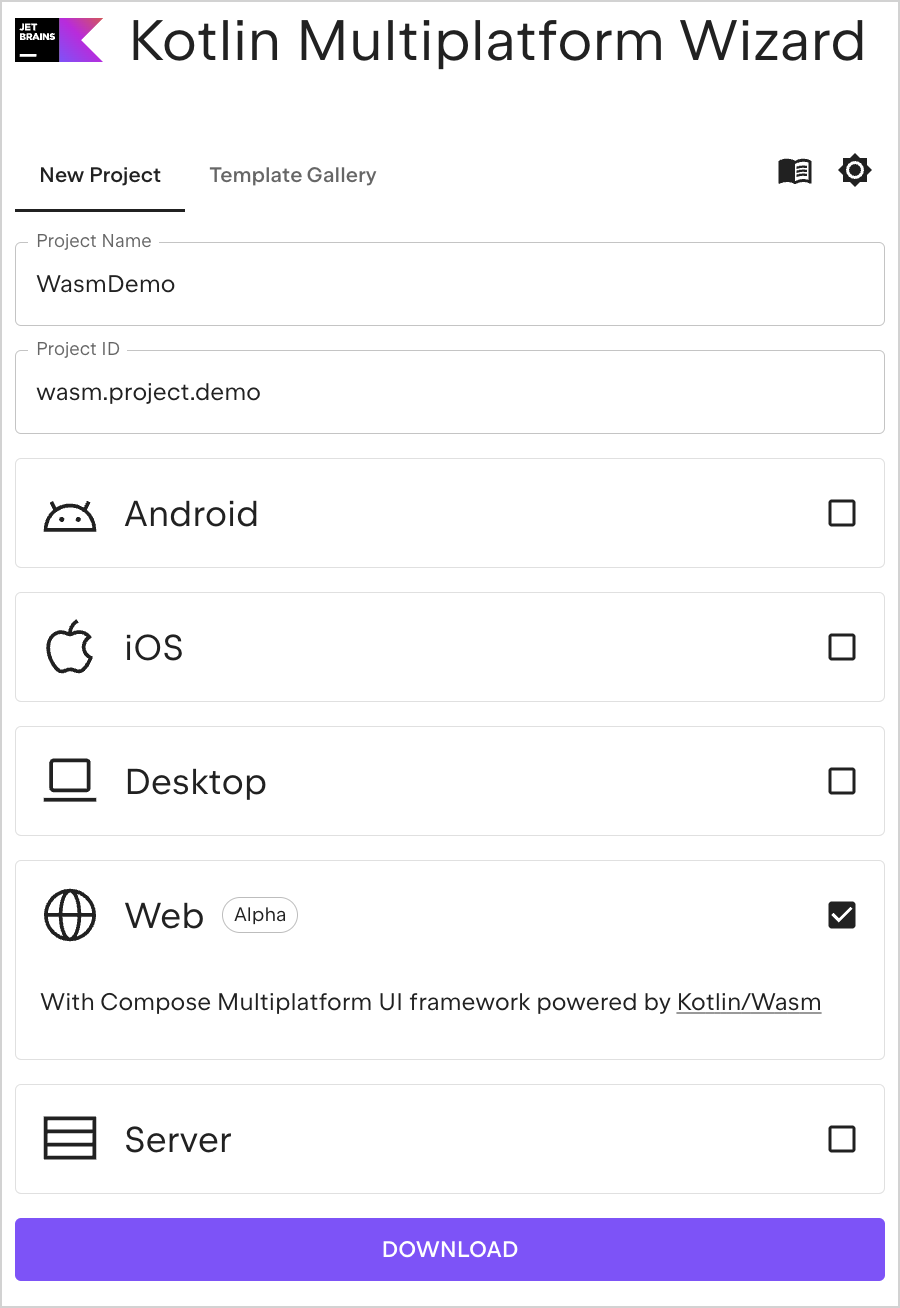
- Open the Kotlin Multiplatform wizard.
On the New Project tab, change the project name and ID to your preference. In this tutorial, we set the name to "WasmDemo" and the ID to "wasm.project.demo".
These are the name and ID of the project directory. You can also leave them as they are.
Select the Web option. Make sure that no other options are selected.
Click the Download button and unpack the resulting archive.
Open the project in IntelliJ IDEA
- Download and install the latest version of IntelliJ IDEA.
- On the Welcome screen of IntelliJ IDEA, click Open or select File | Open in the menu bar.
- Navigate to the unpacked "WasmDemo" folder and click Open.
Run the application
In IntelliJ IDEA, open the Gradle tool window by selecting View | Tool Windows | Gradle.
You need at least Java 11 as your Gradle JVM for the tasks to load successfully.
In composeApp | Tasks | kotlin browser, select and run the wasmJsBrowserDevelopmentRun task.
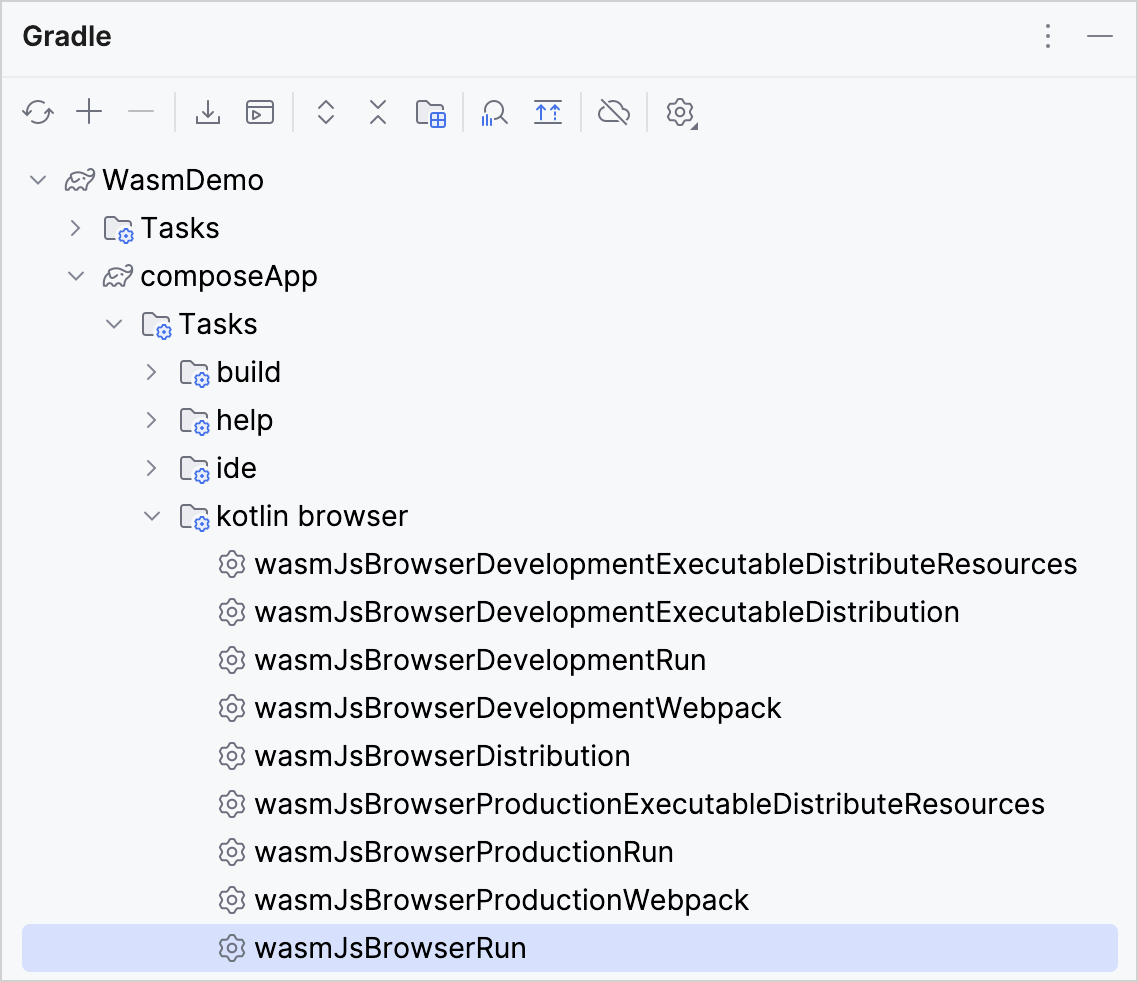
Alternatively, you can run the following command in the terminal from the
WasmDemoroot directory:./gradlew wasmJsBrowserDevelopmentRunOnce the application starts, open the following URL in your browser:
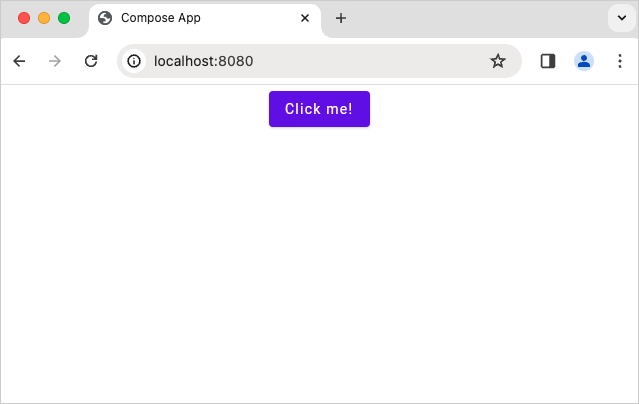
http://localhost:8080/The port number can vary because the 8080 port may be unavailable. You can find the actual port number printed in the Gradle build console.
You see a "Click me!" button. Click it:
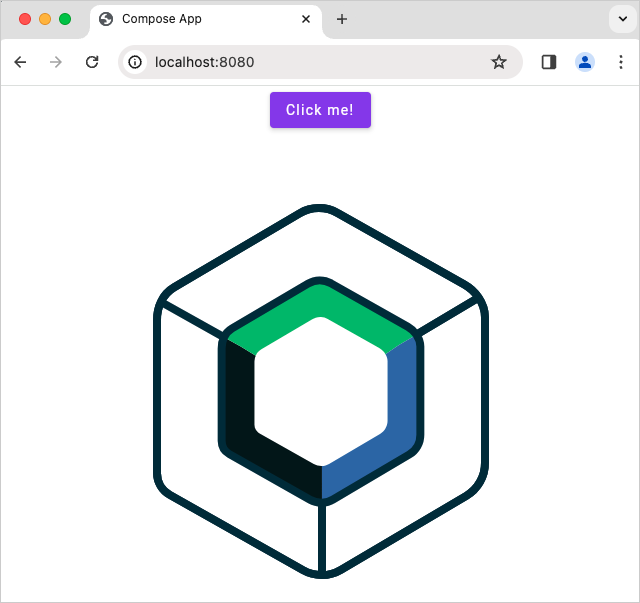
Now you see the Compose Multiplatform logo:
Debug in your browser
Currently, debugging is only available in your browser. In the future, you will be able to debug your code in IntelliJ IDEA.
You can debug this Compose Multiplatform application in your browser out of the box, without additional configurations.
However, for other projects, you may need to configure additional settings in your Gradle build file. For more information about how to configure your browser for debugging, expand the next section.
Configure your browser for debugging
Enable access to project's sources
By default, browsers can't access some of the project's sources necessary for debugging. To provide access, you can configure the Webpack DevServer
to serve these sources. In the ComposeApp directory, add the following code snippets to your build.gradle.kts file.
Add this import as a top-level declaration:
import org.jetbrains.kotlin.gradle.targets.js.webpack.KotlinWebpackConfig
Add this code snippet inside the commonWebpackConfig{} block, located in the wasmJs{} target DSL and browser{} platform DSL within kotlin{}:
devServer = (devServer ?: KotlinWebpackConfig.DevServer()).apply {
    static = (static ?: mutableListOf()).apply {
        // Serve sources to debug inside browser
        add(project.rootDir.path)
        add(project.projectDir.path)
    }
}
The resulting code block looks like this:
kotlin {
    @OptIn(ExperimentalWasmDsl::class)
    wasmJs {
        moduleName = "composeApp"
        browser {
            commonWebpackConfig {
                outputFileName = "composeApp.js"
                devServer = (devServer ?: KotlinWebpackConfig.DevServer()).apply {
                    static = (static ?: mutableListOf()).apply {
                        // Serve sources to debug inside browser
                        add(project.rootDir.path)
                        add(project.projectDir.path)
                    }
                }
            }
        }
    }
}
Currently, you can't debug library sources. We will support this in the future.
Use custom formatters
Custom formatters help display and locate variable values in a more user-friendly and comprehensible manner when debugging Kotlin/Wasm code.
Custom formatters are enabled by default in development builds, so you don't need additional Gradle configurations.
This feature is supported in Firefox and Chromium-based browsers as it uses the custom formatters API.
To use this feature, ensure that custom formatters are enabled in your browser's developer tools:
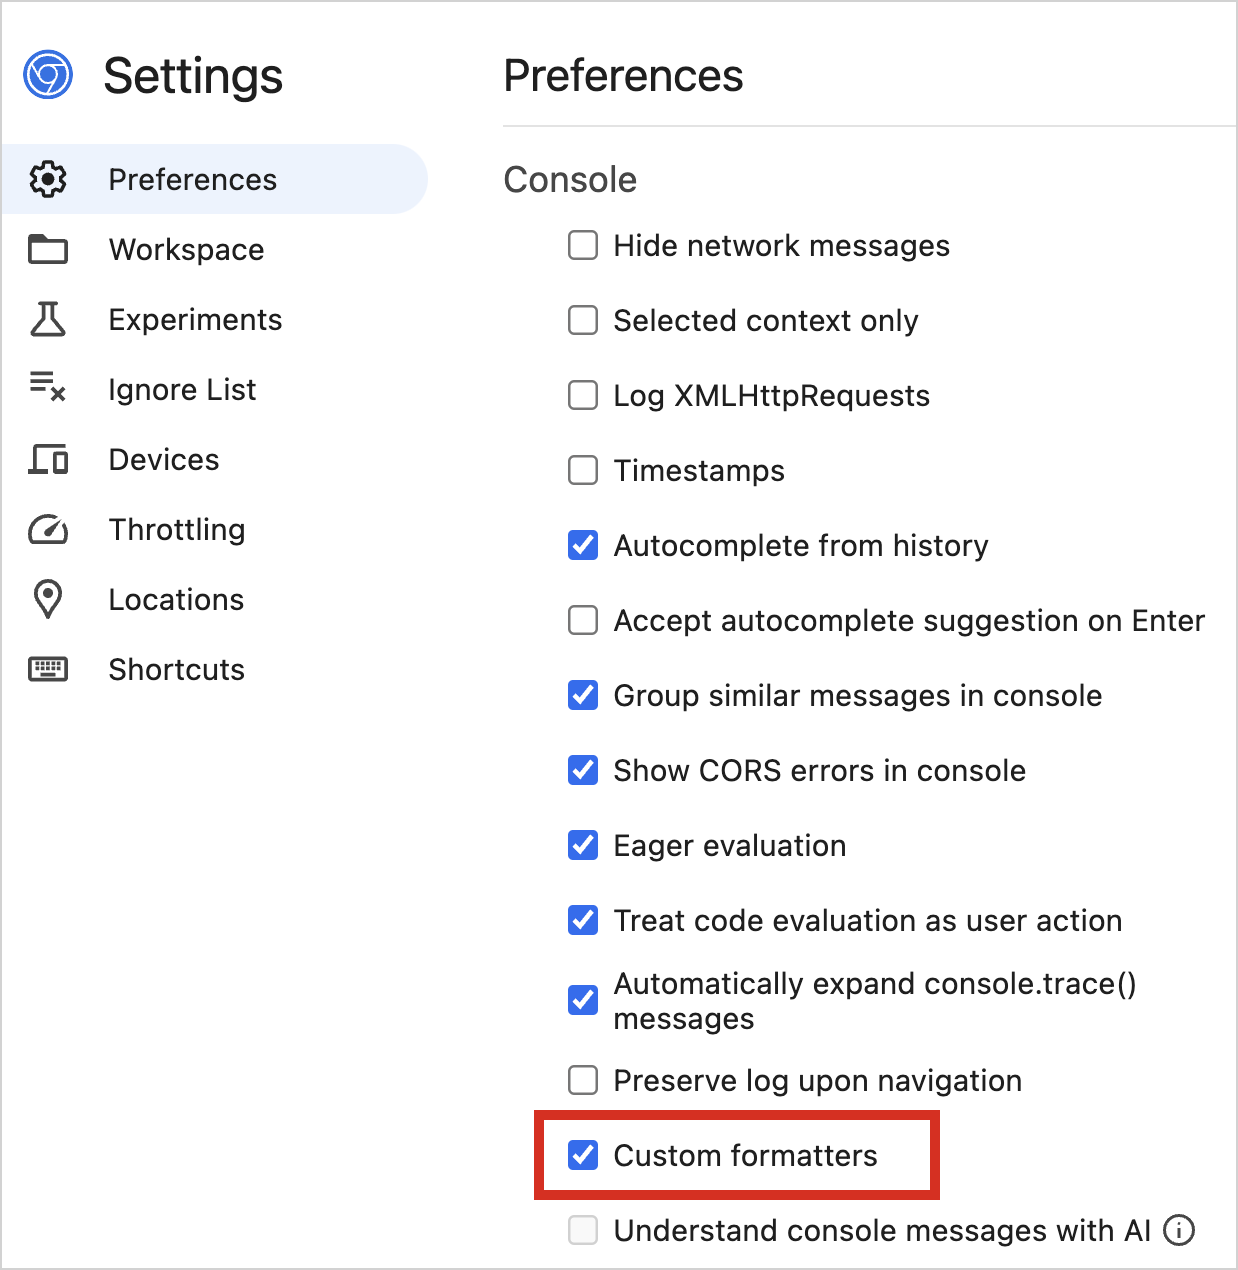
In Chrome DevTools, find the custom formatters checkbox in Settings | Preferences | Console:
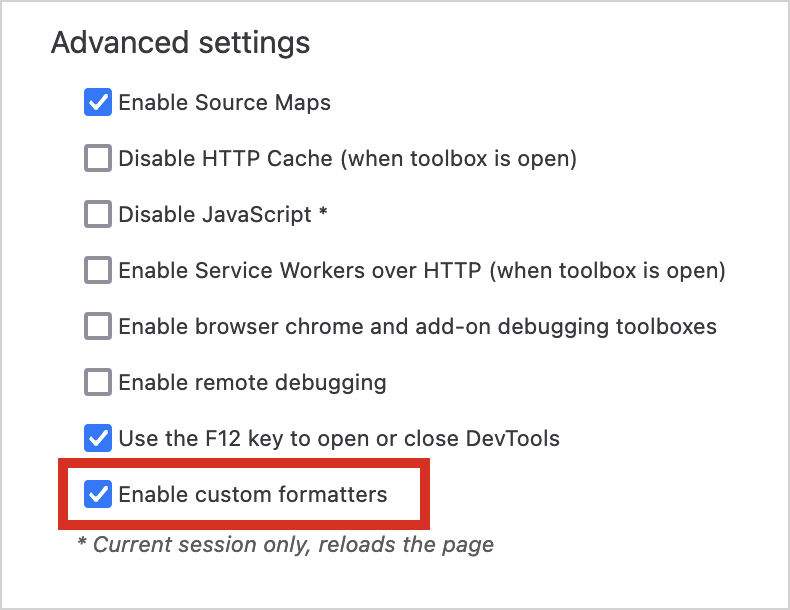
In Firefox DevTools, find the custom formatters checkbox in Settings | Advanced settings:
Custom formatters work for Kotlin/Wasm development builds. If you have specific requirements for production builds,
you need to adjust your Gradle configuration accordingly. Add the following compiler option to the wasmJs {} block:
// build.gradle.kts
kotlin {
    wasmJs {
        // ...

        compilerOptions {
            freeCompilerArgs.add("-Xwasm-debugger-custom-formatters")
        }
    }
}
After enabling custom formatters, you can continue with the debugging tutorial.
Debug your Kotlin/Wasm application
This tutorial uses the Chrome browser, but you should be able to follow these steps with other browsers. For more information, see Browser versions.
In the browser window of the application, right-click and select the Inspect action to access developer tools. Alternatively, you can use the F12 shortcut or select View | Developer | Developer Tools.
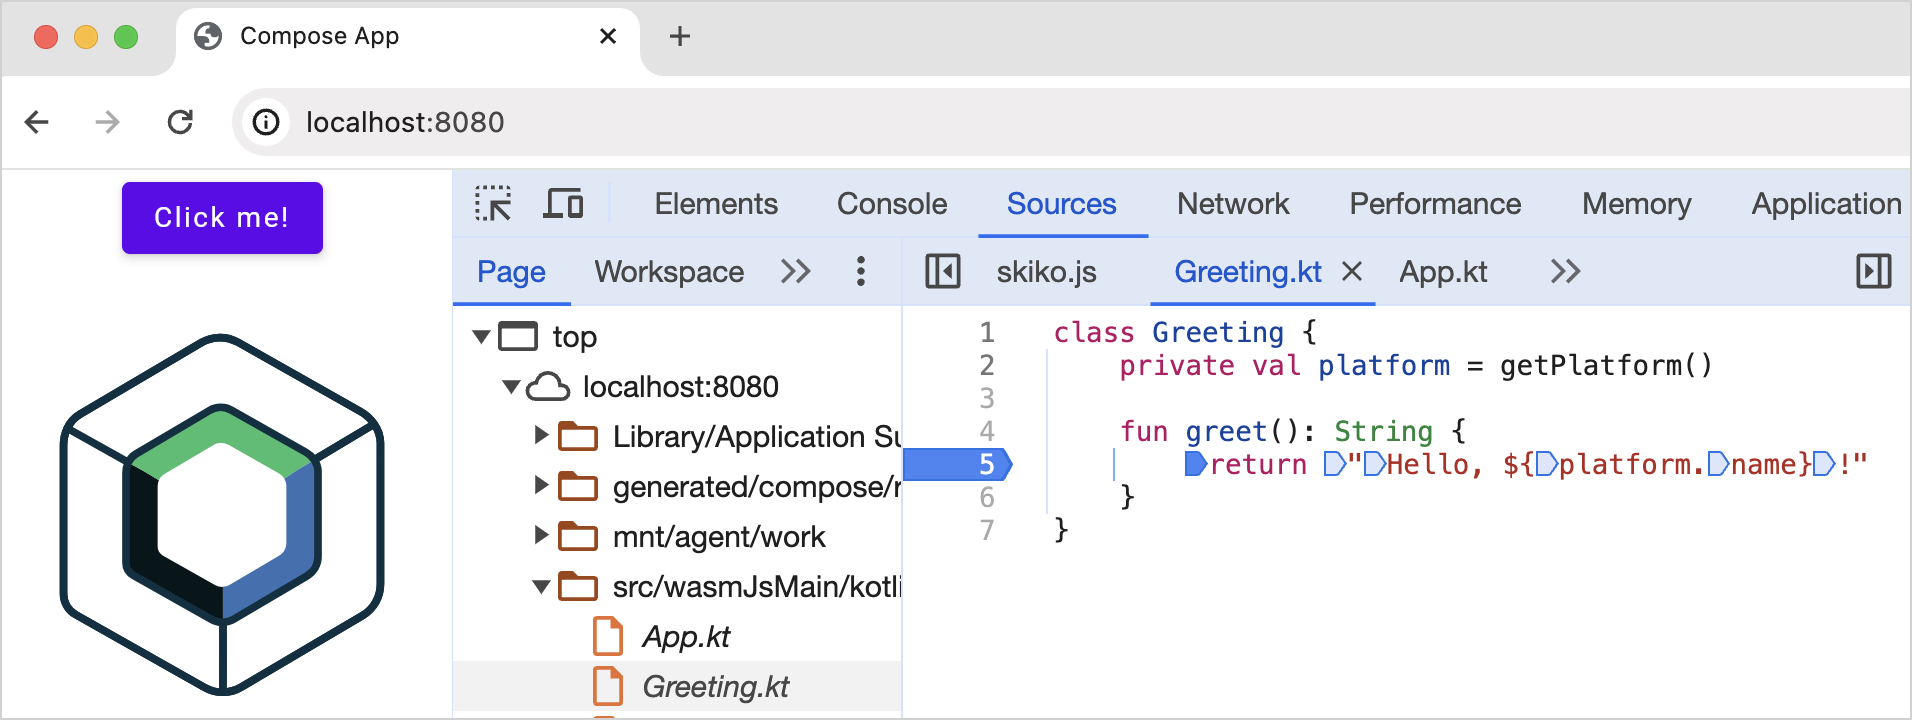
Switch to the Sources tab and select the Kotlin file to debug. In this tutorial, we'll work with the
Greeting.ktfile.Click on the line numbers to set breakpoints on the code that you want to inspect. Only the lines with darker numbers can have breakpoints.
Click on the Click me! button to interact with the application. This action triggers the execution of the code, and the debugger pauses when the execution reaches a breakpoint.
In the debugging pane, use the debugging control buttons to inspect variables and code execution at the breakpoints:
 Step into to investigate a function more deeply.
 Step over to execute the current line and pause on the next line.
 Step out to execute the code until it exits the current function.
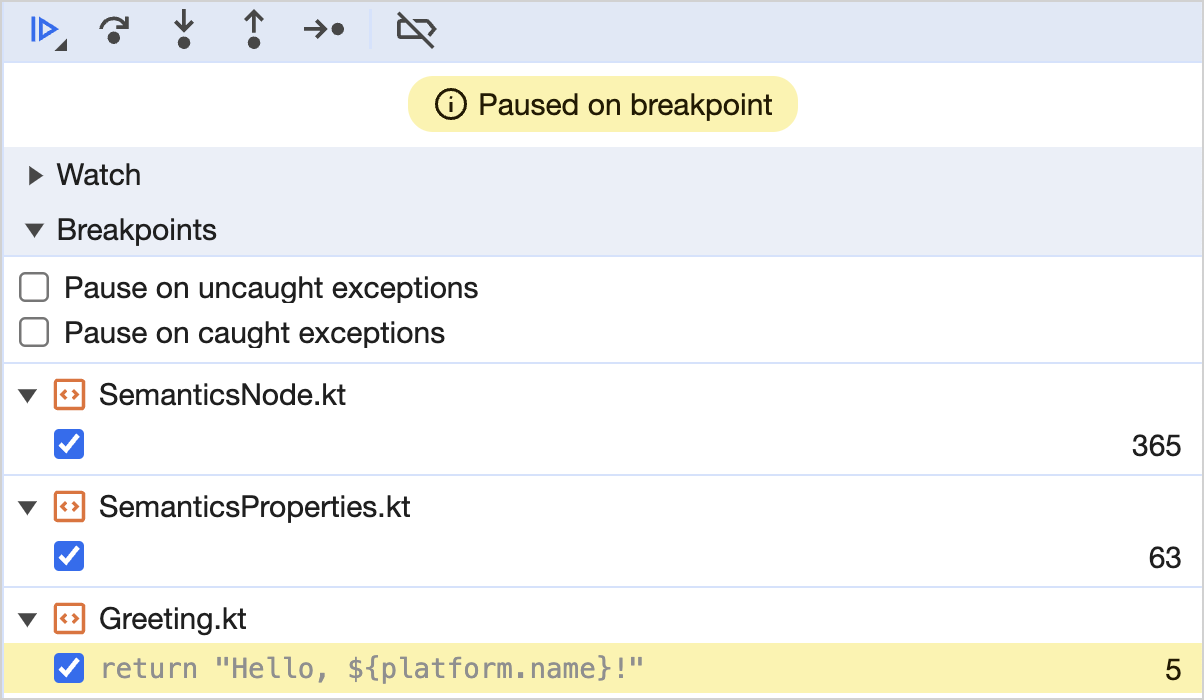
Check the Call stack and Scope panes to trace the sequence of function calls and pinpoint the location of any errors.
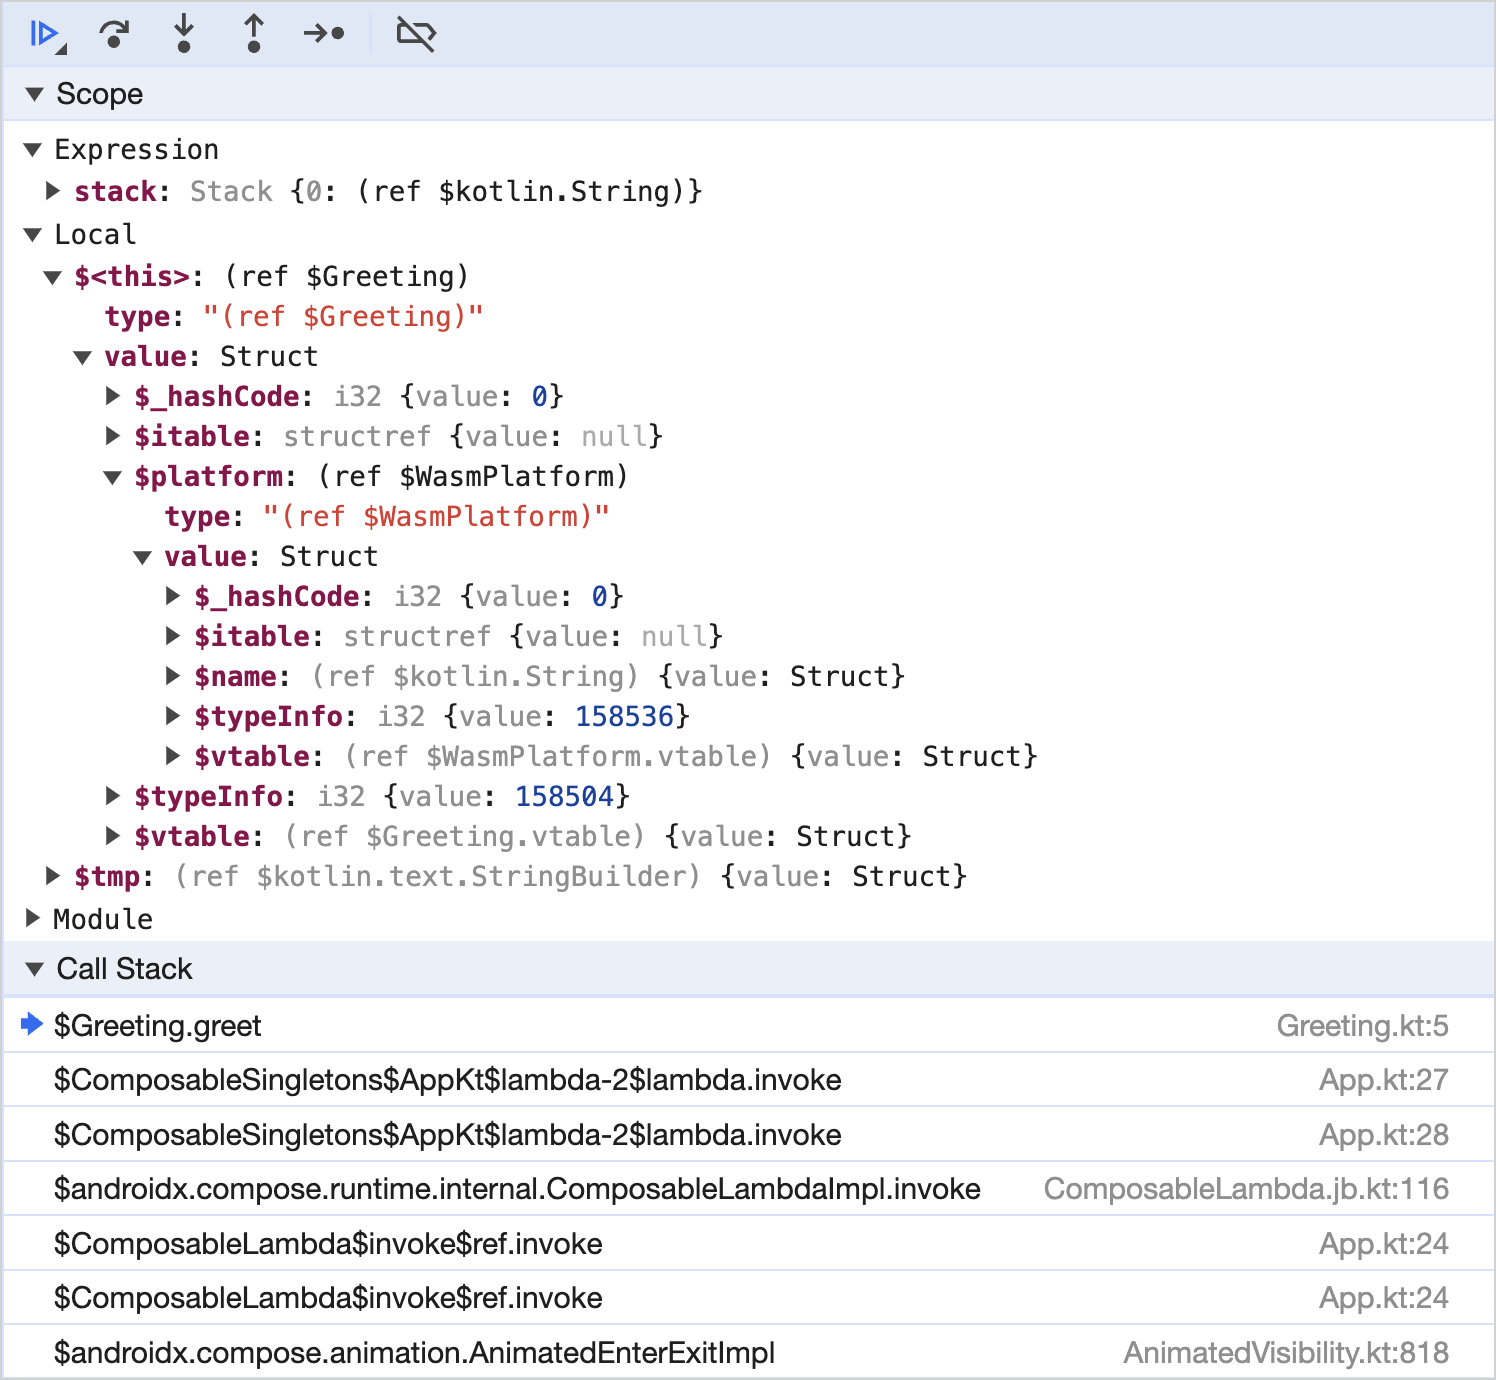
For an improved visualization of the variable values, see Use custom formatters within the Configure your browser for debugging section.
Make changes to your code and run the application again to verify that everything works as expected.
- Click on the line numbers with breakpoints to remove the breakpoints.
Leave feedback
We would appreciate any feedback you may have on your debugging experience!
 Slack: get a Slack invite and provide your feedback directly to the developers in our #webassembly channel.
- Provide your feedback in YouTrack.
下一步做什么?
- See Kotlin/Wasm debugging in action in this YouTube video.
- Try the Kotlin/Wasm examples from our
kotlin-wasm-examplesrepository: