调试 Kotlin/JS 代码
JavaScript source maps provide mappings between the minified code produced by bundlers or minifiers and the actual source code a developer works with. This way, the source maps enable support for debugging the code during its execution.
The Kotlin Multiplatform Gradle plugin automatically generates source maps for the project builds, making them available without any additional configuration.
Debug in browser
Most modern browsers provide tools that allow inspecting the page content and debugging the code that executes on it. Refer to your browser's documentation for more details.
To debug Kotlin/JS in the browser:
- Run the project by calling one of the available run Gradle tasks, for example,
browserDevelopmentRunorjsBrowserDevelopmentRunin a multiplatform project. Learn more about running Kotlin/JS. - Navigate to the page in the browser and launch its developer tools (for example, by right-clicking and selecting the Inspect action). Learn how to find the developer tools in popular browsers.
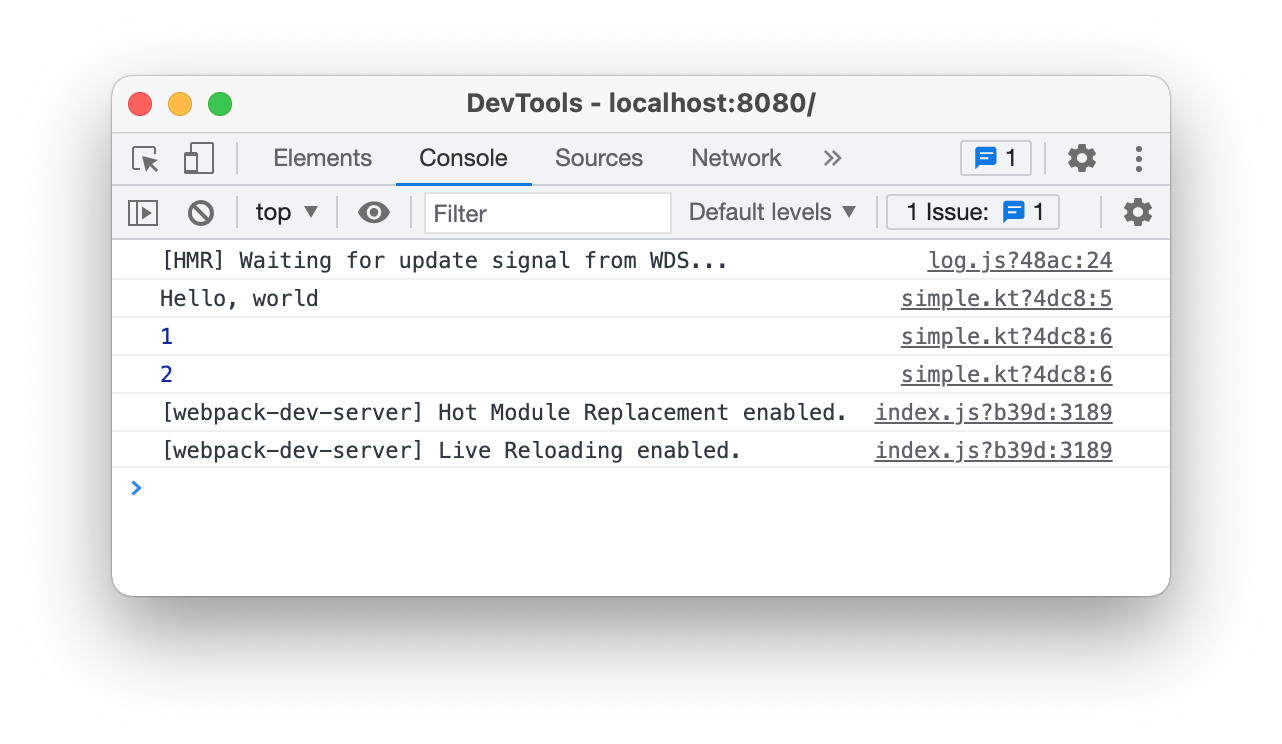
- If your program is logging information to the console, navigate to the Console tab to see this output. Depending on your browser, these logs can reference the Kotlin source files and lines they come from:
- Click the file reference on the right to navigate to the corresponding line of code. Alternatively, you can manually switch to the Sources tab and find the file you need in the file tree. Navigating to the Kotlin file shows you the regular Kotlin code (as opposed to minified JavaScript):
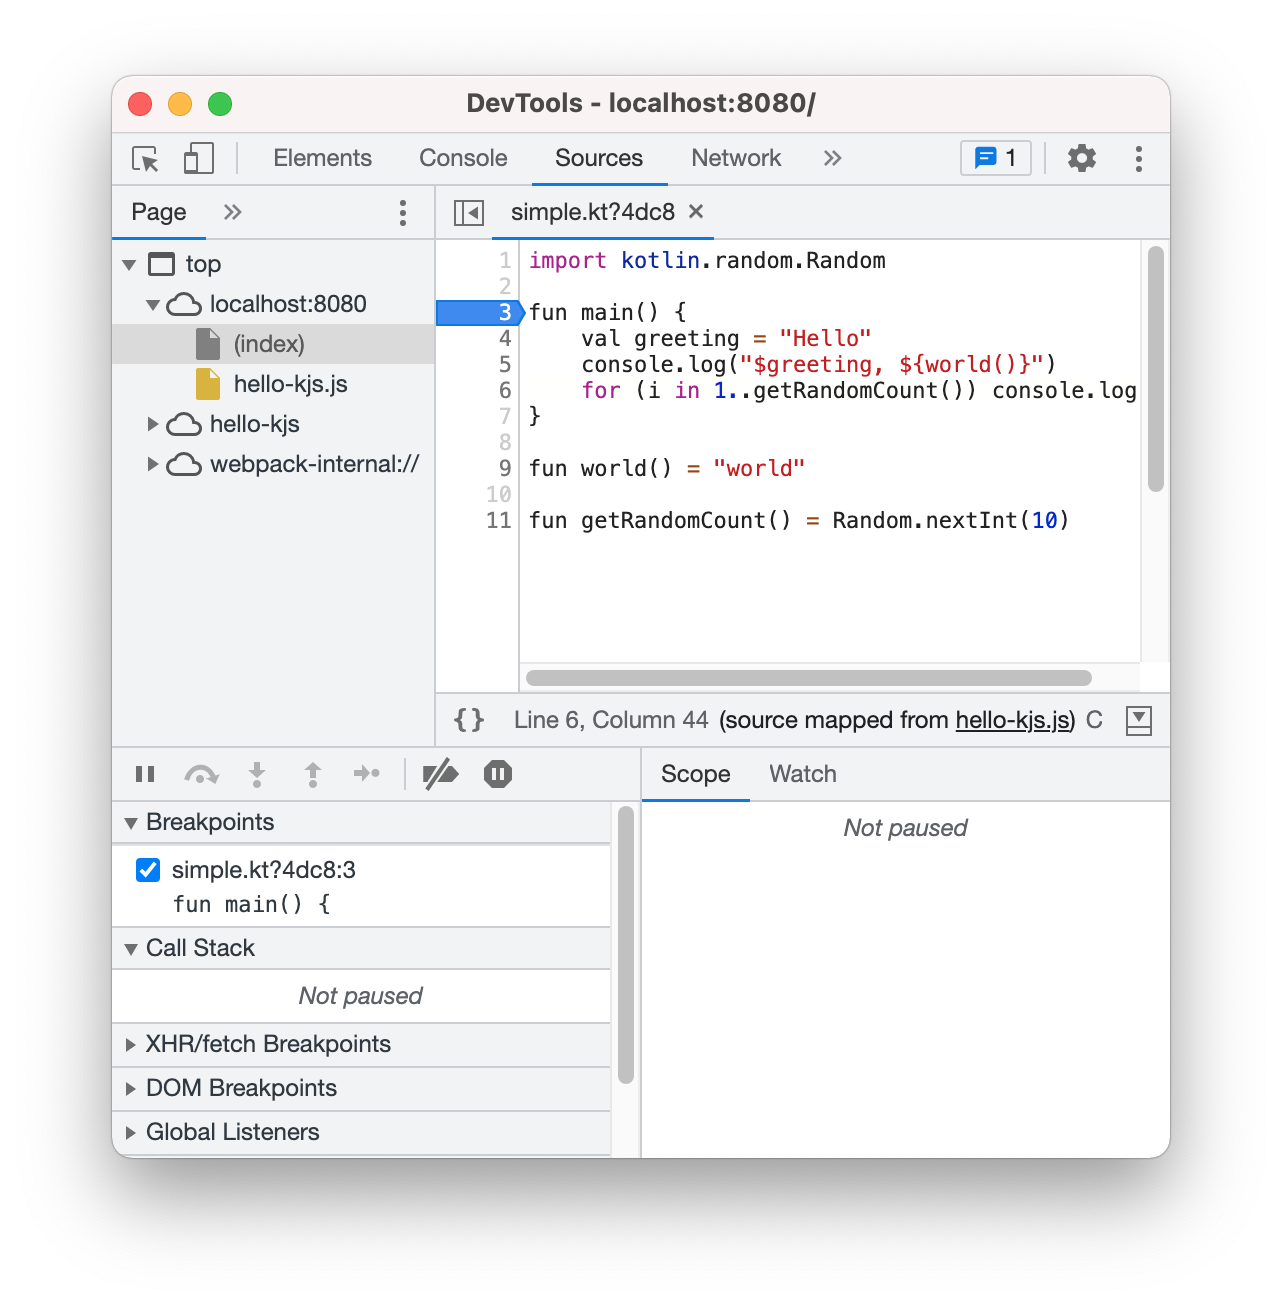
You can now start debugging the program. Set a breakpoint by clicking on one of the line numbers.
The developer tools even support setting breakpoints within a statement. As with regular JavaScript code, any set
breakpoints will persist across page reloads. This also makes it possible to debug Kotlin's main() method which is executed
when the script is loaded for the first time.
Debug in the IDE
IntelliJ IDEA Ultimate provides a powerful set of tools for debugging code during development.
For debugging Kotlin/JS in IntelliJ IDEA, you'll need a JavaScript Debug configuration. To add such a debug configuration:
- Go to Run | Edit Configurations.
- Click + and select JavaScript Debug.
- Specify the configuration Name and provide the URL on which the project runs (
http://localhost:8080by default).
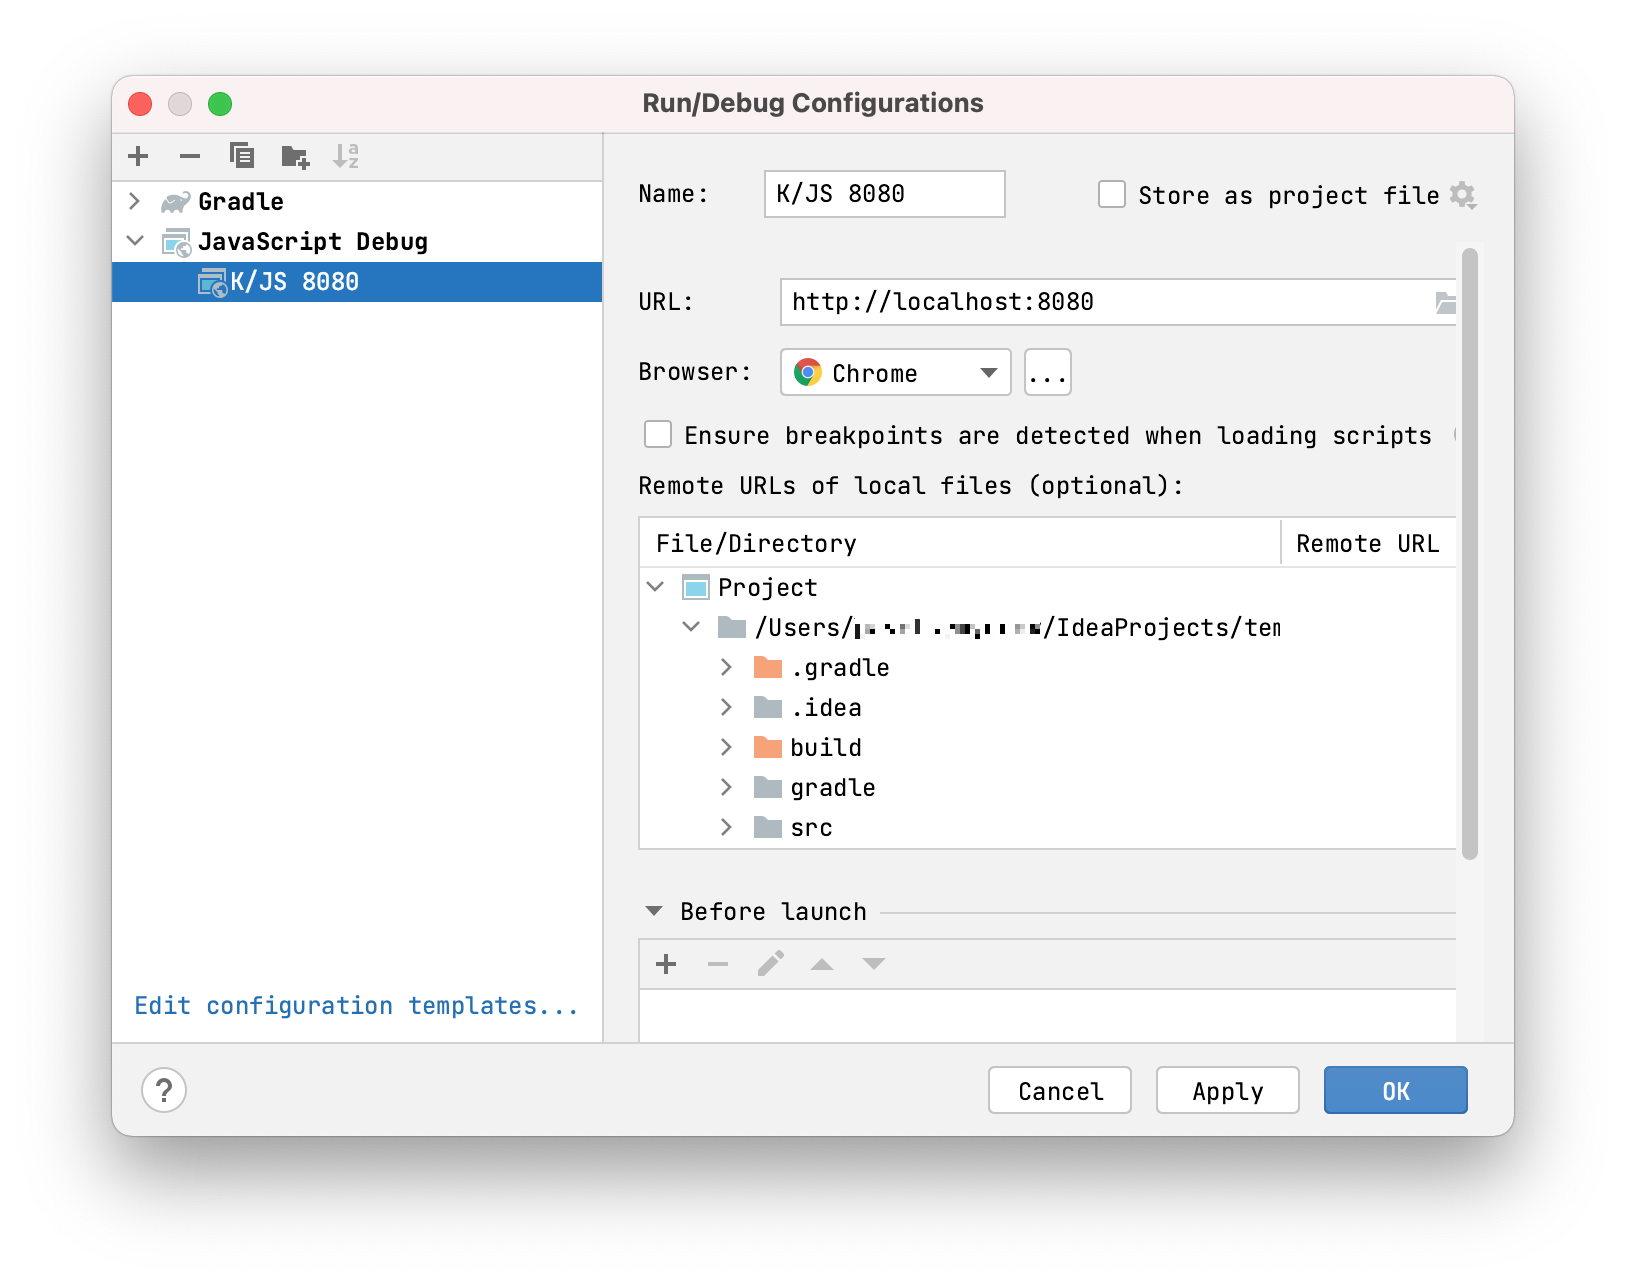
- Save the configuration.
Learn more about setting up JavaScript debug configurations.
Now you're ready to debug your project!
- Run the project by calling one of the available run Gradle tasks, for example,
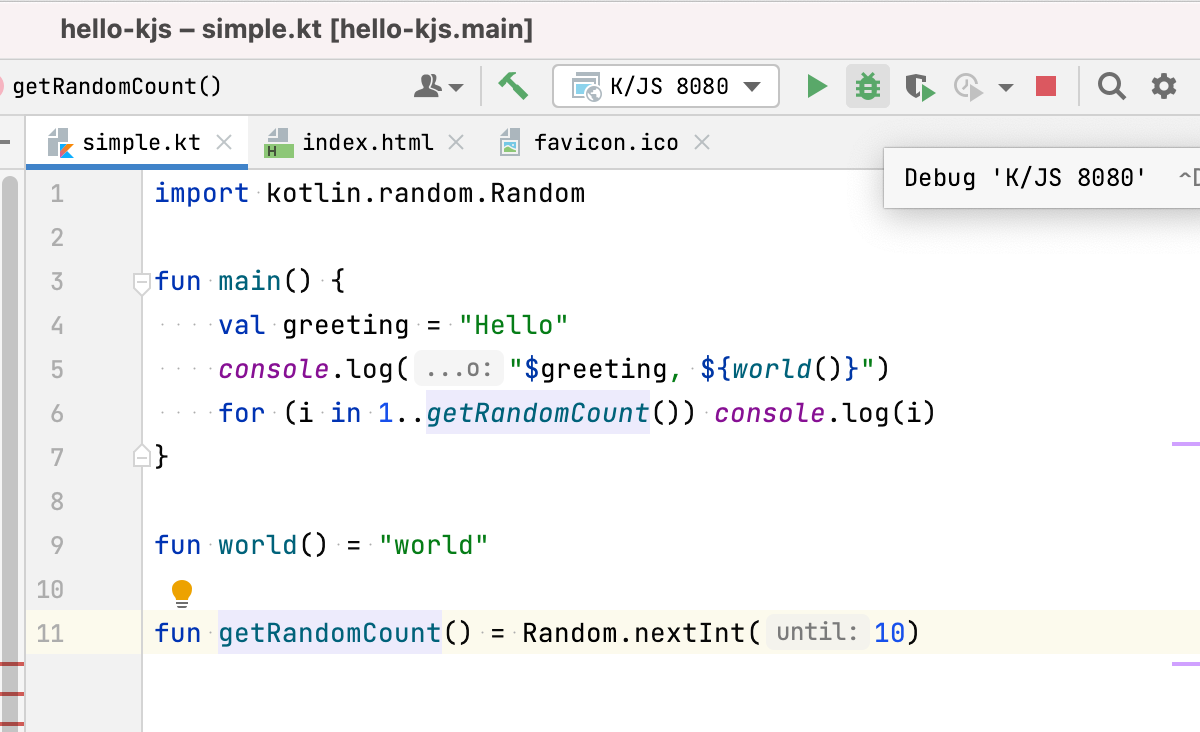
browserDevelopmentRunorjsBrowserDevelopmentRunin a multiplatform project. Learn more about running Kotlin/JS. - Start the debugging session by running the JavaScript debug configuration you've created previously:
- You can see the console output of your program in the Debug window in IntelliJ IDEA. The output items reference the Kotlin source files and lines they come from:
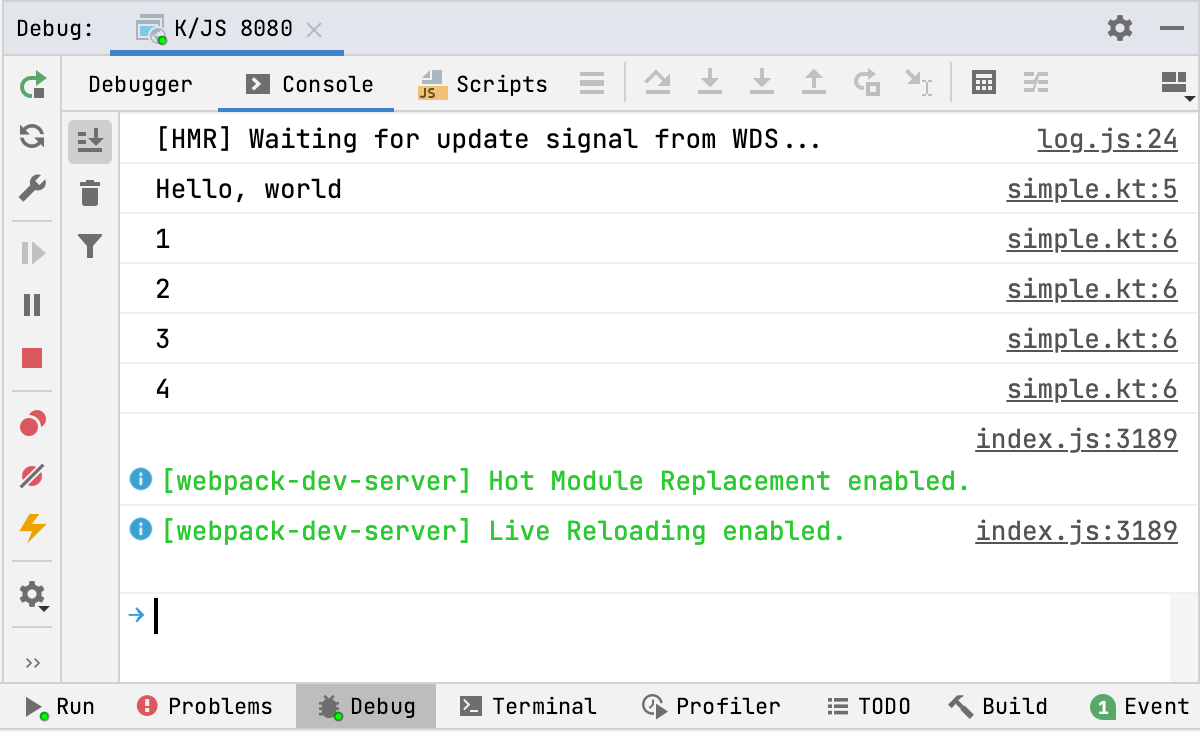
- Click the file reference on the right to navigate to the corresponding line of code.
You can now start debugging the program using the whole set of tools that the IDE offers: breakpoints, stepping, expression evaluation, and more. Learn more about debugging in IntelliJ IDEA.
Because of the limitations of the current JavaScript debugger in IntelliJ IDEA, you may need to rerun the JavaScript debug to make the execution stop on breakpoints.
Debug in Node.js
If your project targets Node.js, you can debug it in this runtime.
To debug a Kotlin/JS application targeting Node.js:
- Build the project by running the
buildGradle task. - Find the resulting
.jsfile for Node.js in thebuild/js/packages/your-module/kotlin/directory inside your project's directory. - Debug it in Node.js as described in the Node.js Debugging Guide.
下一步做什么?
Now that you know how to start debug sessions with your Kotlin/JS project, learn to make efficient use of the debugging tools:
- Learn how to debug JavaScript in Google Chrome
- Get familiar with IntelliJ IDEA JavaScript debugger
- Learn how to debug in Node.js.
If you run into any problems
If you face any issues with debugging Kotlin/JS, please report them to our issue tracker, YouTrack