将依赖添加到 Kotlin Notebook
This is the third part of the Getting started with Kotlin Notebook tutorial. Before proceeding, make sure you've completed the previous steps.
![]() Set up an environment
Set up an environment
![]() Create a Kotlin Notebook
Create a Kotlin Notebook
![]() Add dependencies to a Kotlin Notebook
Add dependencies to a Kotlin Notebook
You've already created your first Kotlin Notebook! Now let's learn how to add dependencies to libraries, which is necessary to unlock advanced features.
The Kotlin standard library can be used out of the box, so you don't have to import it.
You can load any library from the Maven repository by specifying its coordinates using Gradle-style
syntax in any code cell.
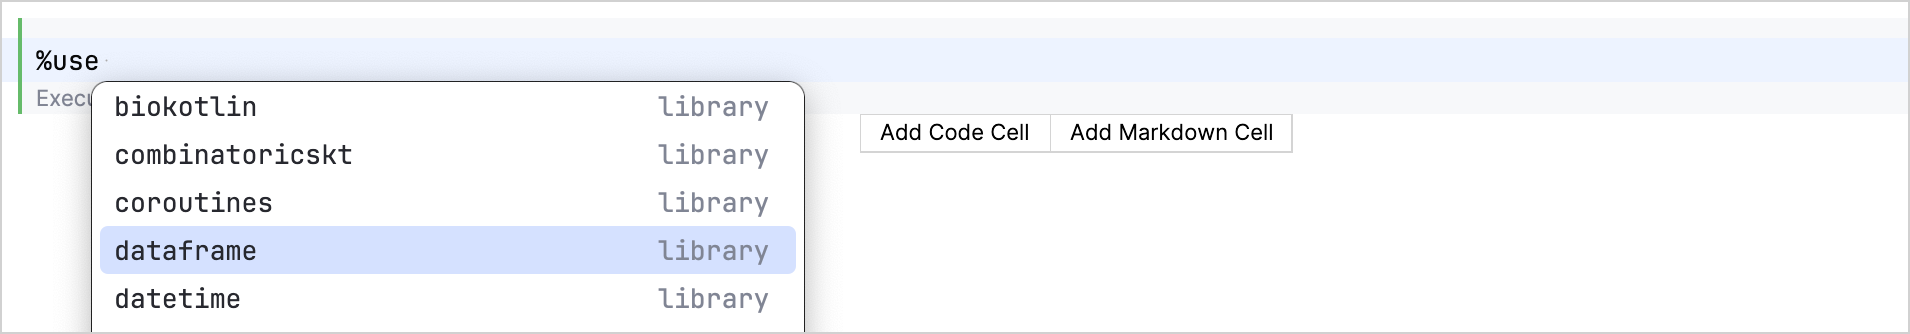
However, Kotlin Notebook has a simplified method to load popular libraries in the form of the %use statement:
// Replace libraryName with the library dependency you want to add
%use libraryName
You can also use the autocompletion feature in Kotlin Notebook to quickly access available libraries:
Add Kotlin DataFrame and Kandy libraries to your Kotlin Notebook
Let's add two popular Kotlin library dependencies to your Kotlin Notebook:
- The Kotlin DataFrame library gives you the power to manipulate data in your Kotlin projects. You can use it to retrieve data from APIs, SQL databases, and various file formats, such as CSV or JSON.
- The Kandy library provides a powerful and flexible DSL for creating charts.
To add these libraries:
- Click Add Code Cell to create a new code cell.
Enter the following code in the code cell:
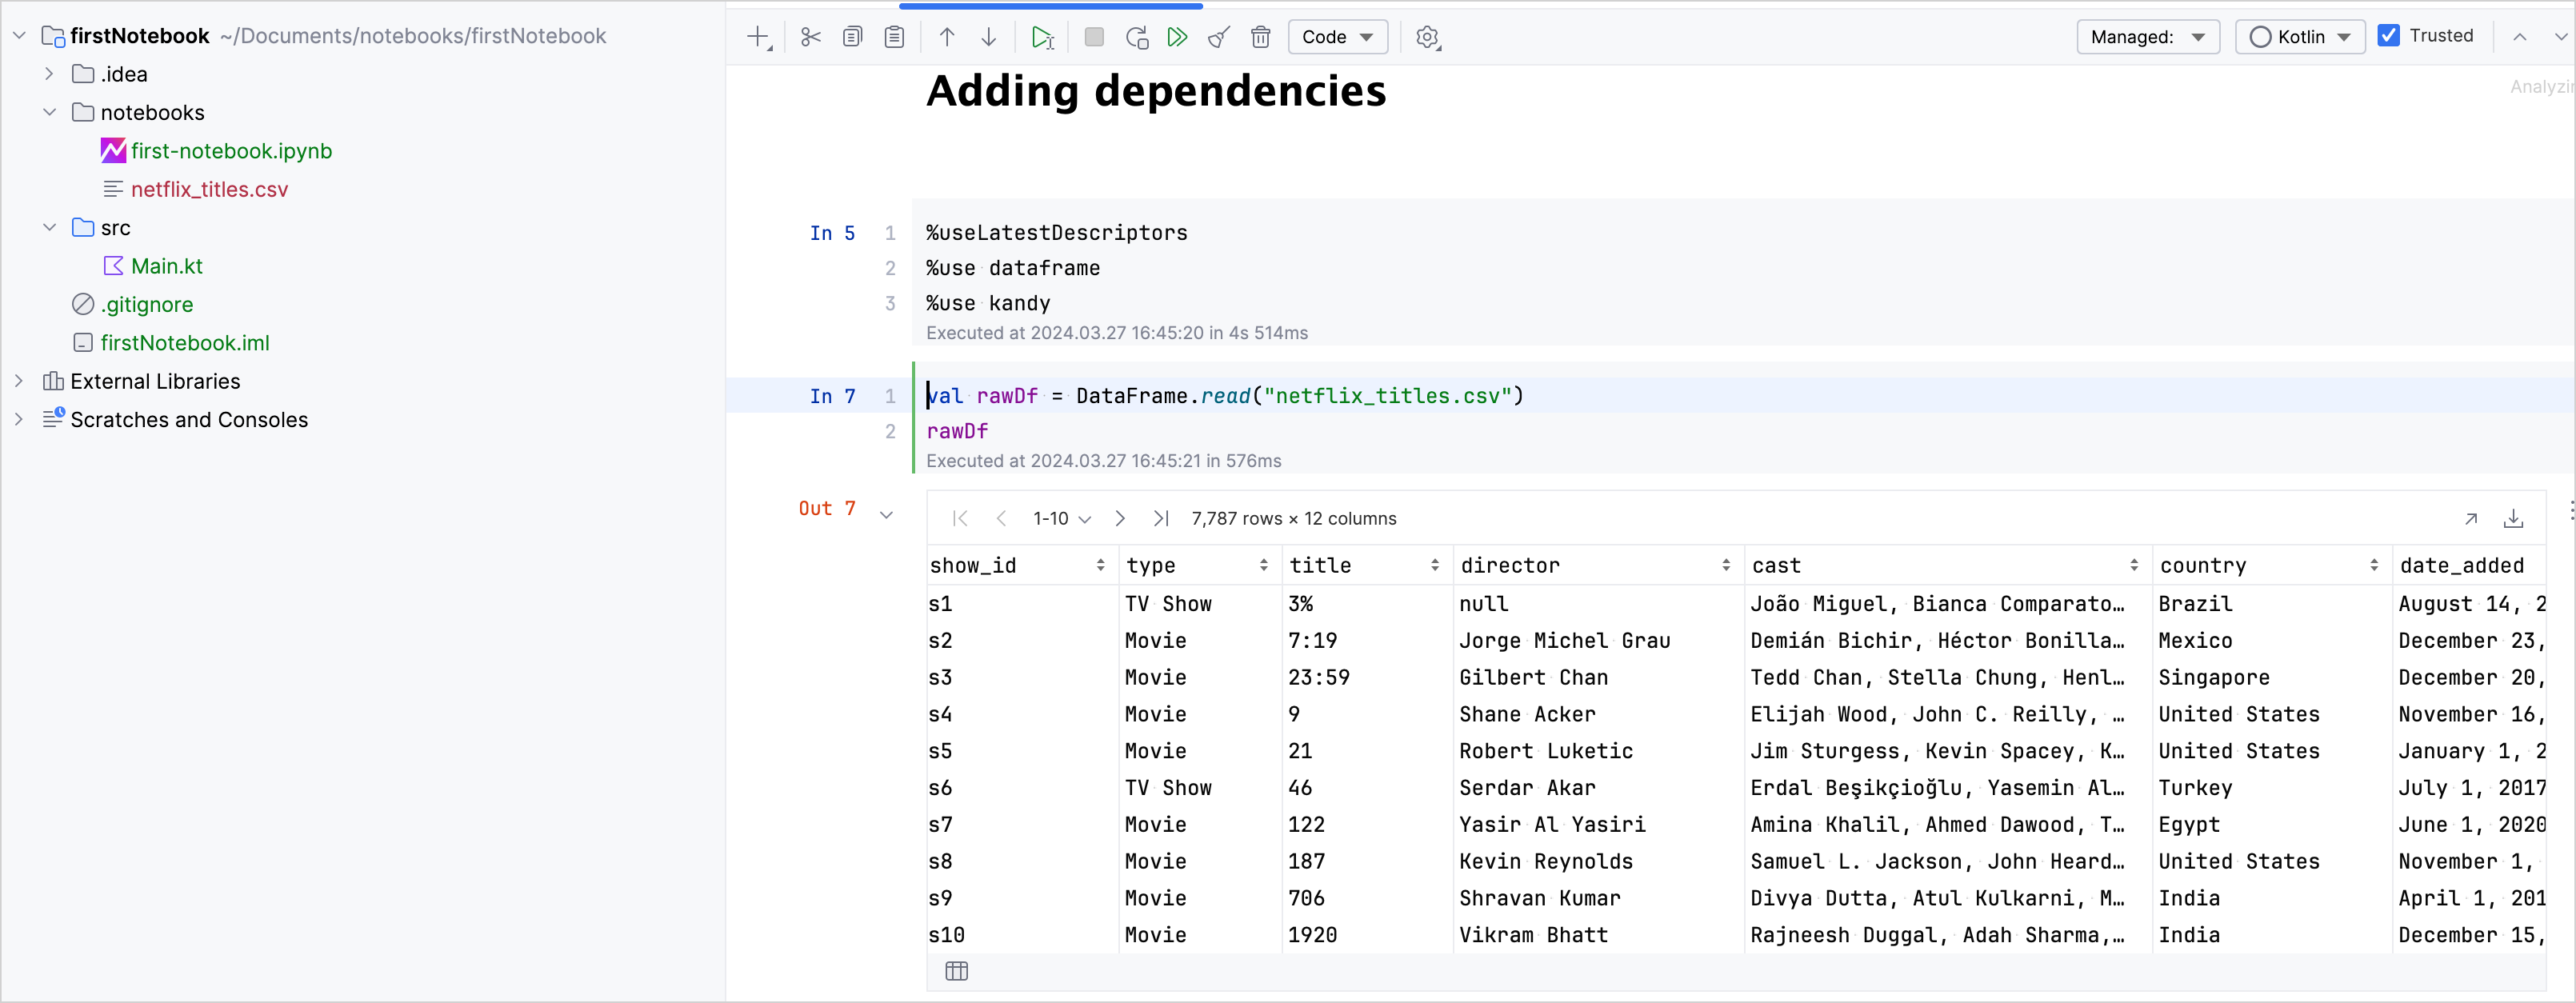
 // Ensures that the latest available library versions are used
 %useLatestDescriptors

 // Imports the Kotlin DataFrame library
 %use dataframe

 // Imports the Kotlin Kandy library
 %use kandy
Run the code cell.
When a
%usestatement is executed, it downloads the library dependencies and adds the default imports to your notebook.Make sure to run the code cell with the
%use libraryNameline before you run any other code cells that rely on the library.To import data from a CSV file using the Kotlin DataFrame library, use the
.read()function in a new code cell:// Creates a DataFrame by importing data from the "netflix_titles.csv" file. val rawDf = DataFrame.read("netflix_titles.csv") // Displays the raw DataFrame data rawDfYou can download this example CSV from the Kotlin DataFrame examples GitHub repository. Add it to your project directory.
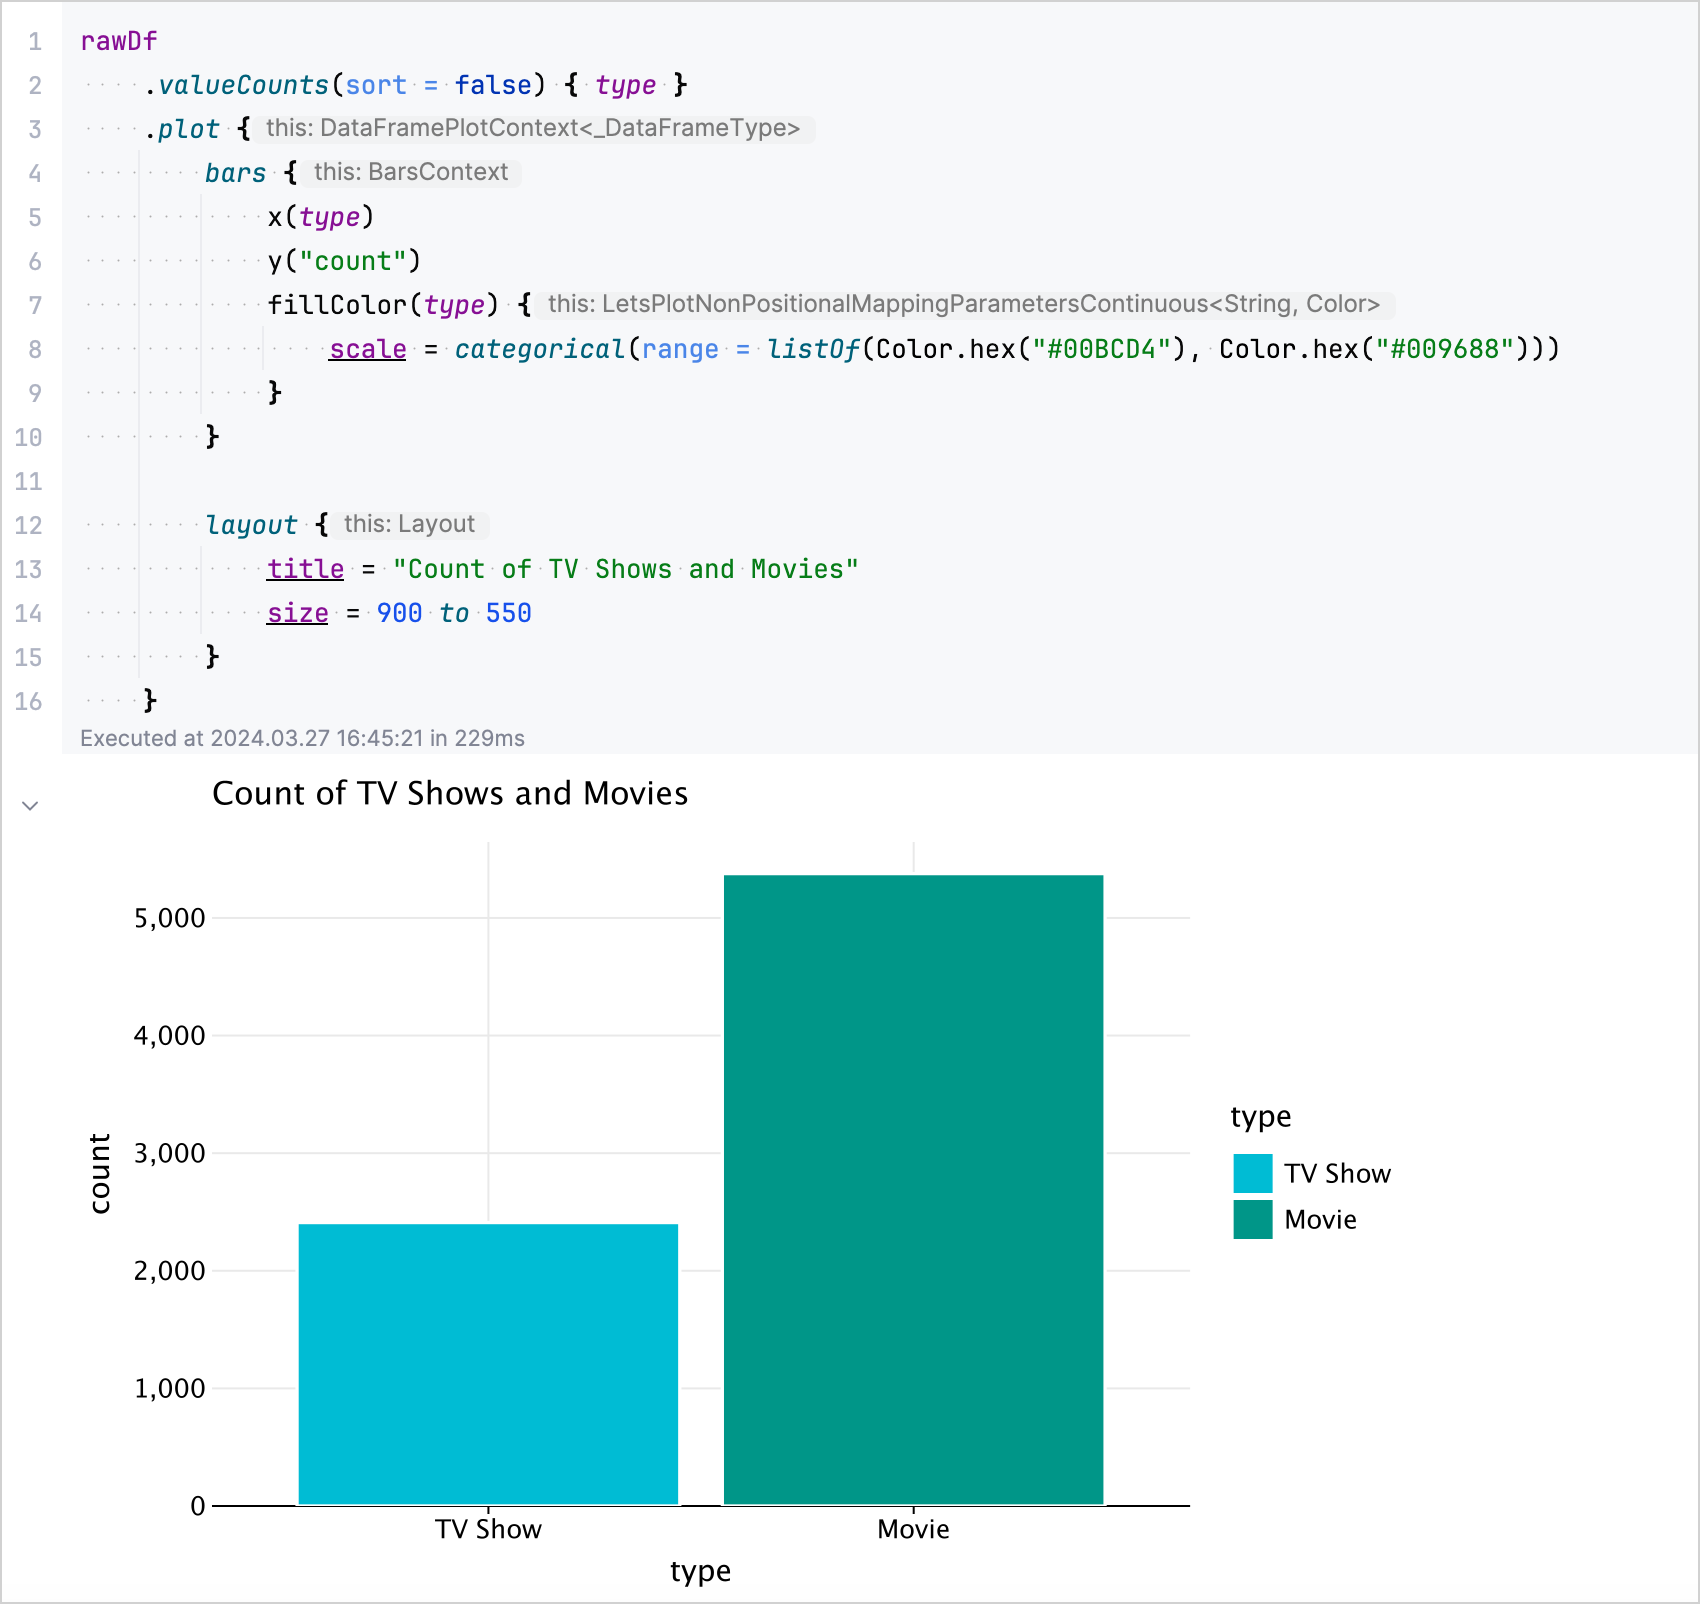
In a new code cell, use the
.plotmethod to visually represent the distribution of TV shows and Movies in your DataFrame:rawDf // Counts the occurrences of each unique value in the column named "type" .valueCounts(sort = false) { type } // Visualizes data in a bar chart specifying the colors .plot { bars { x(type) y("count") fillColor(type) { scale = categorical(range = listOf(Color.hex("#00BCD4"), Color.hex("#009688"))) } } // Configures the layout of the chart and sets the title layout { title = "Count of TV Shows and Movies" size = 900 to 550 } }
The resulting chart:
Congratulations on adding and utilizing these libraries in your Kotlin Notebook! This is just a glimpse into what you can achieve with Kotlin Notebook and its supported libraries.
下一步做什么
- Learn how to share your Kotlin Notebook
- See more details about adding dependencies to your Kotlin Notebook
- For a more extensive guide using the Kotlin DataFrame library, see Retrieve data from files
- For an extensive overview of tools and resources available for data science and analysis in Kotlin, see Kotlin and Java libraries for data analysis